

Five catalysts that could drive a pickup in volatility
- 08.28.26
- Markets & Investing
- Commentary
Review the latest Weekly Headings by CIO Larry Adam.
Key takeaways:
- US-Iran war reaches the six-month mark, markets still looking past the conflict
- Warsh has an opportunity to reset the narrative at Jackson Hole
- Warnings on US debt after 30-year yield climbed to a 19-year high
Despite ongoing geopolitical tensions, growing questions about the scale of AI-related spending and steadily rising bond yields, market volatility remained remarkably subdued this summer. In fact, the VIX averaged just 15.3 in August, more than three points below its 20-year August average of 18.9. More strikingly, this August's peak VIX reading was only 16.5. History suggests, however, that this period of calm may not last.
As August comes to a close, markets are entering a historically more volatile stretch of the calendar, spanning late August through mid-October. Given the combination of geopolitical, fiscal and monetary policy risks ahead, investors may be underestimating the potential for turbulence. To that end, we highlight five key catalysts that could challenge the market's recent complacency and drive a pickup in volatility in the weeks and months ahead.
War reaches its six-month mark
Today marks six months since the start of the US-Iran conflict. Despite an initial drawdown of nearly 10%, markets have largely looked through the disruption, with the S&P 500 up approximately 12% and near record highs. Yet while investors have moved on, a lasting resolution remains out of reach.
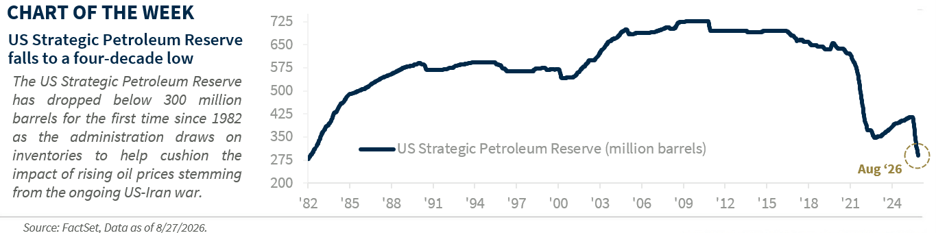
The conflict has increasingly shifted from military confrontation to economic warfare, but the strain on energy markets remains significant. While Persian Gulf exports are still constrained, emergency stockpile releases have helped contain prices, keeping oil well below its post-war peak of approximately $113 per barrel, but that cushion is fading as the Strategic Petroleum Reserve (SPR) sits near a 40-year low. With exports restricted and inventories being steadily depleted, we are raising our year-end 2026 WTI target by $5 to $75 per barrel. While that change should have only a modest impact on growth and inflation, the bigger risk is that markets have become too comfortable. With the conflict unresolved and emergency stockpiles running low, any renewed escalation could quickly reignite oil prices and broader market volatility.
Warsh’s dilemma
Kevin Warsh inherited a difficult backdrop: a president calling for lower rates, a conflict that has kept inflation above the Fed’s 2% target and a Federal Open Market Committee (FOMC) divided on the path ahead. At the same time, his calls for “regime change” at the Fed and reduced reliance on forward guidance have unsettled markets and contributed to higher bond yields.
Today’s Jackson Hole speech is his first opportunity to reset the narrative. With yields near multi-year highs and investors looking for clarity on the Fed’s reaction function, markets want a better understanding of how policymakers will respond to shifts in inflation, employment and financial conditions. More uncertainty could fuel another rise in yields and market volatility, while a clear framework could help stabilize markets after the recent sell-off. Ultimately, Warsh has a chance to frame his vision as an evolution of the Fed’s framework, not a revolution, helping strengthen credibility and confidence.
Windfall earnings
As second quarter earnings season wraps up, corporate fundamentals remain strong. Revenue growth is running near 16% year over year – double the historical average – while S&P 500 earnings are on pace to rise 49%, the strongest gain in five years. Recent technology earnings also eased concerns around the market’s largest sector, with semiconductor companies showing sustained AI demand, software companies pointing to resilient subscription revenues and cybersecurity firms benefiting from rising AI-related threats.
With earnings season ending, however, investor focus is likely to shift back toward macro risks. September has historically been the S&P 500’s weakest month, averaging a 0.6% decline since 1950 and 0.9% decline during midterm election years. As a result, increased volatility would not be surprising.
Washington eyes the midterms
Midterm election years have historically been among the most volatile periods for markets. Since 1930, the S&P 500 has experienced an average drawdown of 12.6% between May and October in midterm years, compared to a typical decline of approximately 7%. While markets have remained resilient, betting markets now assign an 89% probability that Democrats take the House and a 51% probability they take the Senate, putting the elections increasingly in focus. The midterms are also influencing the global landscape, with Canada taking a firmer stance in trade negotiations and Iran appearing more willing to keep energy prices elevated ahead of the election.
Warnings on US debt
Last week, the national debt surpassed $40 trillion, putting fiscal sustainability back in focus as the 30-year Treasury yield climbed to a 19-year high of 5.31%. With annual interest costs above $1 trillion and approximately $8 trillion of debt maturing over the next year, the financing burden is becoming increasingly sensitive to higher rates.
While Treasury Secretary Bessent has downplayed the significance of the $40 trillion threshold, his decision to increase long-duration Treasury buybacks suggests growing concern about borrowing costs. Although the expanded program, estimated at approximately $14 billion over the next two months, is too small to materially influence long-term yields, the signal is notable.
Bottom line
For the equity market, we expect volatility to rise as investors navigate renewed geopolitical, fiscal and monetary policy uncertainty, but strong earnings and solid fundamentals should make any pullback a buying opportunity. For the bond market, any further increase in Treasury yields would provide an attractive opportunity to selectively add exposure and modestly extend duration.
All expressions of opinion reflect the judgment of the author(s) and the Investment Strategy Committee and are subject to change. This information should not be construed as a recommendation. The foregoing content is subject to change at any time without notice. Content provided herein is for informational purposes only. There is no guarantee that these statements, opinions or forecasts provided herein will prove to be correct. Past performance is not a guarantee of future results. Indices and peer groups are not available for direct investment. Any investor who attempts to mimic the performance of an index or peer group would incur fees and expenses that would reduce returns. No investment strategy can guarantee success.
Economic and market conditions are subject to change. Investing involves risks including the possible loss of capital.
The information has been obtained from sources considered to be reliable, but we do not guarantee that the foregoing material is accurate or complete. Diversification and asset allocation do not ensure a profit or protect against a loss.
The S&P 500 Total Return Index: The index is widely regarded as the best single gauge of large-cap U.S. equities. There is over USD 7.8 trillion benchmarked to the index, with index assets comprising approximately USD 2.2 trillion of this total. The index includes 500 leading companies and captures approximately 80% coverage of available market capitalization.
Sector investments are companies focused on a specific economic sector and are presented here for illustrative purposes only. Sectors, including technology, are subject to varying levels of competition, economic sensitivity, and political and regulatory risks. Investing in any individual sector involves limited diversification.